The Walk Forward Out-Of-Sample Metric Performance Explorer v8x
1. How to Use The Walk Forward Metric Explorer
2. How To Find a Good Metric Filter In The WFME Ave File Output
3. How To Find Strategy Inputs to Use For Trading In The Future
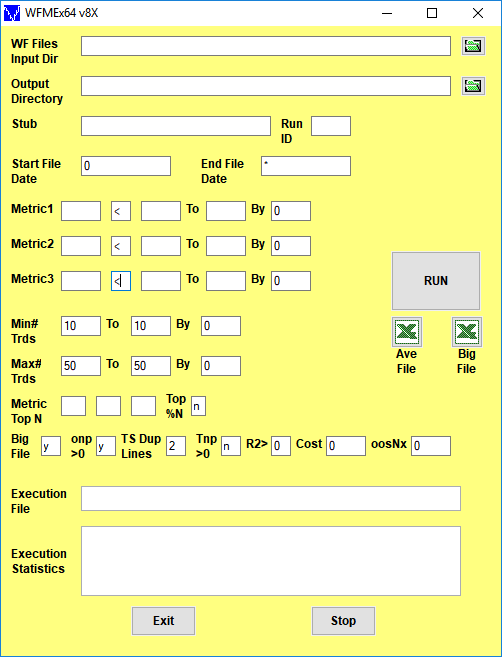
Click here for a description of the WFME64 v8x Form inputs shown above
Note: On first use, the form inputs are blank as above. The WFME saves whatever user inputs are entered onto the form and thereafter loads those inputs onto the form with next use
The Walk Forward Out-Of-Sample Metric Performance Explorer v8x
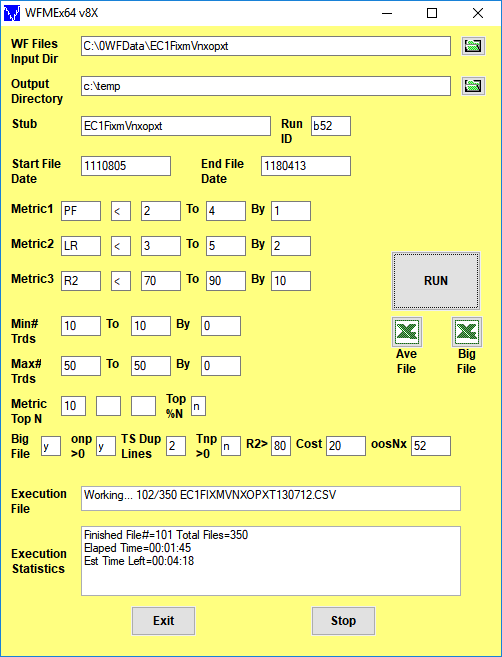
The Walk Forward Metric Explorer (WFME) v8x is a standalone 64bit exe program that is super-fast and automatically displays its extensive statistical results in Excel. The WFME reads all files generated by the PWFO and searches each PWFO file for the best combination of in-sample performance metrics, also called filters that generate the statistically best average out-of-sample performance. A filter summary is generated and sorted by total out-of-sample net profits after costs for all metric combination filters examined and written to a comma delimited Excel file by the WFME. In addition, using modern "Bootstrap" techniques, the WFME calculates the probability of whether each filter's out-of-sample results were due to chance. When the WFME run is done just click on the Excel Icon next to the Run button and the WFME output file will appear in Excel or your spreadsheet.
To see an example and description of the WFME64 v8x AVE run output file click here
Data Mining and Curve Fitting.
Data mining or curve fitting a price series will always produce the best performance results. If you look hard enough using optimization you will always find patterns in the price data by mistaking chance fluctuations for genuine effects. But they are not real. Why use the PWFO walk forward technique? Why not just perform a TradeStation optimization on the whole price series and choose the input parameters that give the best total net profits or profit factor? Whenever you run a optimization (combinatorial search} over many different combinations of input parameters on noisy data on a fixed number of prices, no matter how many, the best performance parameters found are guaranteed to be due to "curve fitting" the noise and signal. When we run, say, 5000 different input parameter combinations , the best performance parameters will be from those system input variables that are able to produce profits from the price pattern and the random spurious price movements While the price patterns, if there, will repeat, the same spurious price movements will not. If the spurious movements that were captured by a certain set of input parameters were a large part of the total net profits, then choosing these input parameters will produce losses when traded on future data. These losses occur because the spurious movements will not be repeated in the same way. This is why system combinatorial searches with no out-of-sample in-sampling cause loses when traded in real time from something that looked great in the in-sample section.
In order to gain confidence that our system input parameter selection procedure on in-sample data will produce profits "on average" in the future we must perform the walk forward out-of-sample analysis many times. Why not just do the analysis once or three times? Well just as in poker, where there is considerable vagaries in hand to hand luck, walk forward out-of-sample analysis give considerable vagaries in week to week out-of-sample profit "luck". That is, by pure chance we may have chosen some input parameters that did well in the in-sample section data and the three out-of-sample section runs. In order to minimize this type of "luck", statistically, we must repeat the walk forward out-of-sample (oos) analysis over many in-sample/oos sections and take the average of our weekly results over all out-of-sample sections (we need at least 50 oos sections for statistically significant results). This average gives us an expected weekly return and a standard deviation of weekly returns which allows us to statistically estimate the expected equity and it's range for N weeks in the future.
Walk Forward Performance Metric Explorer (WFME) Description.
Below are examples of the many filters the WFME can generate in a run and the logic behind the metric filters described.
The PWFO generates a number of performance metrics in the in-sample(IS) section. (Please see http://meyersanalytics.com/Walk-Forward-Optimization.html for a listing of these performance metrics). The question we are attempting to answer statistically, is which performance metric or combination of performance metrics (which we will call a filter) in the in-sample section will produce strategy inputs that produce statistically valid profits in the out-of-sample section. In other words we wish to find a metric filter that we can apply to the in-sample section that can give us strategy inputs that will produce, on average, good trading results in the out-of-sample sections. The PWFO produces a total of 32 different performance metrics in the in-sample section. If we have 5000 different input combinations then the in-sample section consists of 32 columns of PWFO performance metrics for each of the 5000 different strategy inputs or rows.
An example of a simple filter would be to choose the row in the in-sample section that had the highest net profit or perhaps a row that had one the best performance metric from one of the other 32 PWFO metrics. Unfortunately it was found that this type of simple filter very rarely produces good out-of-sample results. More complicated metric filters can produce good out-of-sample results minimizing spurious price movement biases in the selection of strategy inputs.
The WFME metric filters are composed of two screens. The first screen consists of eliminating those rows in the in-sample section that do not meet the Metric1, Metric2 and/or Metric3 conditions. For instance we know that high profit factors(PF) in the in-sample section usually mean that the signal and the noise have been curve fitted. By eliminating all rows in the IS section that have a PF>4, we eliminate many of those curve fitted IS strategy inputs. The PWFO metric R2 is defined as the in-sample trade equity regression trend line coefficient of correlation r^2. r^2 is a measure of how well a straight line fits the equity curve generated by a set of in-sample strategy inputs. High R2 values in the IS section usually mean poor performance in the out-of-sample section because of curve fitting the signal and noise in the IS section. By eliminating all rows in the IS section that have a R2>90, we eliminate many of those curve fitted IS strategy inputs. With the two metric filter PF<4|R2<90, we have eliminated many rows in the IS section that curve fitted the noise and the signal. We can stop at this PF<4|R2<90 screen and choose from the rows left in the IS section, the row that has the highest value of one of the other 32 PWFO metrics. Suppose we chose the row after the PF<4|R2<90 row elimination that has the highest PWFO metric mTrd. mTrd is the medium rather than average of all the trades in the IS section for a given set of strategy inputs. The final filter would then be PF<4|R2<90-mTrd. This filter applied to the each IS section would produce strategy inputs to be used in each out-of-sample section. The WFME can search for many combinations of PF, R2 and PWFO Metrics in one run by simply putting in the ranges as shown in the WFME form above. In addition, the user is free to choose which PWFO metrics he wishes to use to eliminate curve fitted rows in the IS section. I chose PF and R2 in this example because that's what I use most often.
If we wanted to stop at just a first screen run we would set the WFME form inputs Metric Top N boxes to blank. If we did this using the values shown in the form example above but with the Metric Top N boxes set to blank, we would generate the following WFME Ave output. The WFME columns are described below Below. Shown is the first screen WFME computer run along with a small sample of other filter combinations that are constructed in a similar manner. Notice that the out-of-sample results from a first screen metric filter are not as good as the two screen metric filter described below.
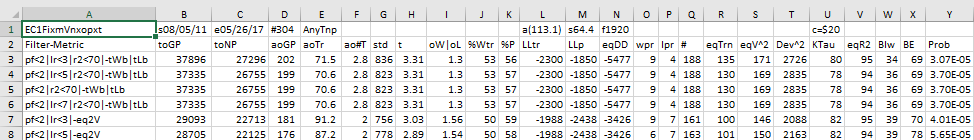
We could stop at this first of screen or go to a second screen which usually results in better out-of-sample performance. Below describes a second screen run.
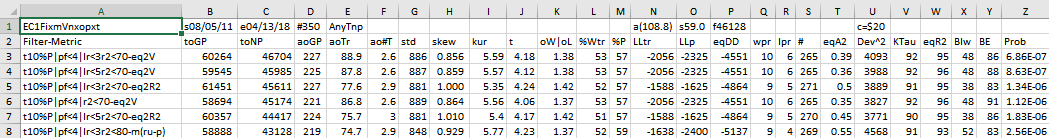
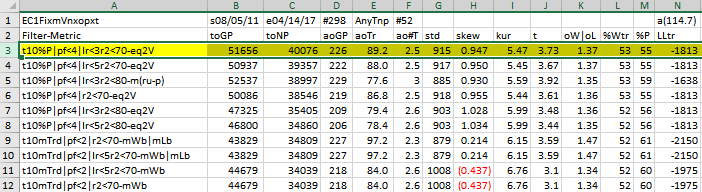
Here is a three metric screen combination filter from a WFME run shown in the WFME form above with good out-of-sample results. High profit factors (PF) in the in-sample section usually mean poor performance in the out-of-sample-section. This is a kind of reversion to the mean. So in the in-sample section we eliminate all strategy input rows that have a PF>4. The PWFO metric R2 is defined as the in-sample trade equity regression trend line coefficient of correlation r2. r2 is a measure of how well a straight line fits the equity curve generated by a set of in-sample strategy inputs. High r2 values in the in-sample section usually mean poor performance in the out-of-sample-section. This is a kind of reversion to the mean as well and a measure of how well the price noise is being fitted in the in-sample section. So, in the in-sample section we eliminate all strategy input rows that have a r2>70. After using the pf-r2 filter, as described, there can still be 100s of rows left in the in-sample section. Few traders can stay with a strategy that has many losing trades in a row lr. For this metric we will limit the number losing trades in a row in the 30 day in-sample period to 3 or less lr<3. The PWFO generates the metric %P. %P is the percentage of profitable trades in the in-sample section for a given set of strategy inputs. Let us choose the 10 rows in the in-sample section that contain the highest(top) number of %P from the rows that are left after the PF-R2-LR elimination. This particular filter will now leave 10 cases or rows in the in-sample section that satisfy the above filter conditions. Suppose for this filter, within the 10 in-sample rows that are left, we want the row that has the maximum metric eq2V in the in-sample section. eq2V is the Velocity of a 2nd Order Polynomial Line fit to the equity curve evaluated at the end of the equity curve. Combining all above, this would produce a filter named t10%P|pf<4|lr<3|r2<70-eq2V. This in-sample filter leaves only one row in the PWFO in-sample section with its associated strategy inputs and out-of-sample net profit in the out-of-sample section. This particular t10%P|pf<4|lr<3|r2<70-eq2V filter finds the strategy inputs parameters in each of the 350 in-sample sections and applies these inputs to each of the 350 out-of-sample sections. Using the filter's in-sample strategy inputs on the 350 out-of-sample sections, the average out-of-sample performance is calculated. In addition many other important out-of-sample performance statistics for this filter are calculated and summarized. Below we show such a filter computer run along with a small sample of other filter combinations that are constructed in a similar manner. Row 3 of the sample output shown below shows the results of the filter discussed above. A total of 46128 different metric filters were examined. We chose Row 3 because it had a lower BE, BLW and Dev^2 and a higher KTau and eqR2 along with better statistics than the rows below it. More on this below and on how that number of filters combinations effect the probability that the filter chosen was or was not due to chance
The WFME64 v8x Ave File Run Definition
After the WFME has completed its run click in the Excel icon above Ave File on the WFME form and the Ave File automatically loads into Excel. Below is a snippet of the Ave File output from a WFME run sorted by total out-of-sample net profits (toNP). This example shows the partial output file from a WFMEx64v8 run on the PWFOv5t files generated with the Nth Order Fixed Memory Polynomial Strategy that was run on 1 contract of the Euro(EC) 1 minute bar futures for the 298 weeks from 8/5/2011 to 4/14/2017. The in-sample(IS) period is 30 calendar days and the out-of-sample(OOS) period is 7 calendar days or one week. Sundays were automatically skipped because this strategy only traded between 7am to 1500 CST.
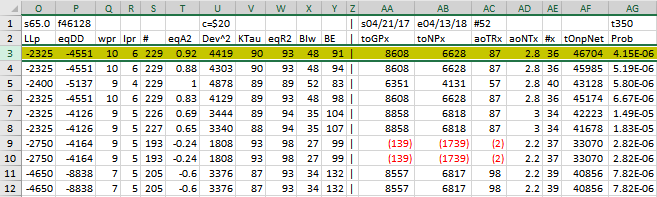
52 weeks(Row 1 Col AC) from 4/21/17 to 4/13/18 were withheld from the WFME64 run. The WFME64 only ran the 298 PWFO files from 8/05/11 to 4/14/17. The 52 weeks from 4/21/17 to 4/13/18 are the "future" results of what would have happened if you used the filter found using the 298 PWFO files from 8/05/11 to 4/14/17 on the "future" dates of 4/21/17 to 4/13/18.
The WFME Columns are defined as follows
- Row 1, Columns
- Col A=The PWFO Stub
- Col B=File Start Date
- Col C=File End Date
- Col D= Number of oos periods(in this example weeks)
- Col N= Bootstrap average
- Col O= Bootstrap Standard Deviation
- Col P=Number of filters run
- Col U= Cost/trade
- Col AA: Future PWFO File Start Date
- Col AB: Future PWFO File End Date
- Col AC: Future Number of PWFO Files not included in the WFME64 run (in this example weeks)
- Col AG: Number of Total oos+future PWFO Files
- Row 2 Columns AA,AB,AC,AD,AE
These are Future Results Not Included in the WFME64 Run. These set of results show how it would turn out if the Strategy/Filter was used on pwfo files not included in the WFME64 run.
- Col AA: toGPx Total gross profit for the 52 future excluded periods (for this run periods = weeks).
- Col AB: toNPx Total Net profit (toGP-Number Of Trade Weeks*cost) for the 52 future excluded periods.
- Col AC: aoTrx Average profit per trade for the 52 future excluded periods
- Col AD: aoNTx Average number of trades per week for the 52 future excluded periods
- Col AE: #x The number of the 52 future excluded periods this strategy/filter traded. Note for some periods there can be no strategy inputs/filter that satisfy the Strategy Inputs/Filter criteria and no trades will be made during that period.
- Row 2, Columns A through AH:
- Filter-Metric = The filter that was run on the 298 PWFO in-sample sections from 8/5/2011 to 4/14/2017. For example on Row 3, t10%P|pf<4|lr<3|r2<70-eq2V is: Top(highest) 10 %P, the percentage of profitable trades in the in-sample section after eliminating the in-sample rows that don't meet the following criteria: Profit Factor <=4, consecutive losers in a row <=3, equity regression trend line coefficient of correlation r2<=70. Out of the top 10 %P rows left the WFME chooses the in-sample row with the highest eqV2(Velocity of a 2nd Order Polynomial Line fit to the equity curve) metric.
- toGP = Total out-of-sample(oos) gross profit for these 298 oos periods(for this run periods = weeks).
- toNP = Total out-of-sample(oos) Net profit(toGP-Number Of Trade Weeks*cost) for the 298 oos periods.
- aoGP = Average oss gross profit for the 298 oos periods
- aoTr = Average oos profit per trade
- ao#T = Average number of oos trades per week
- std = The standard deviation of the 298 oos periods
- t = The student t statistic for the 298 oos periods. The higher the t statistic the higher the probability that this result was not due to pure chance
- oW|oL = Ratio of average oos winning trades divided by average oos losing trades .
- %Wtr = The percentage if oos winning trades
- %P = percent of all oos periods that were profitable.
- LLtr = The largest losing oos trade in all oos periods
- LLp = The largest losing oos period
- eqDD = The oos equity drawdown
- wpr = The largest number of winning oos periods (weeks) in a row.
- lpr = The largest number of losing oos periods in a row
- # = The number of oos periods this filter produced any profit or loss. Note for some oos periods there can be no strategy inputs that satisfy a given filters criteria and no trades will be made during that period.
- eqTrn = The straight line trend of the oos equity curve in $/oos period.
- eqV^2 = The velocity of a 2nd order polynomial that is fit to the equity curve.
- Dev^2 = A measure of equity curve smoothness. The square root of the average (equity curve minus a straight line)^2)
- KTau^2 = The Kendall rank coefficient is often used as a test statistic in a statistical hypothesis test to establish whether two variables may be regarded as statistically dependent. This test is non-parametric, as it does not rely on any assumptions on the distributions of X or Y or the distribution of (X,Y)
- eqR2 = The correlation coefficient(R^2) of a straight line fit to the equity curve.
- Blw = The maximum number of oos periods the oos equity curve failed to make a new high.
- BE = Break even in oos periods. Assuming the average and standard deviation are from a normal distribution, this is the number of oos periods you would have to trade to have a 98% probability that your oos equity is above zero.
- Prob = The probability that the filters oos toNP was due to pure chance. Row 1 lists the random bootstrap average for the 298 out-of-sample files of ($114.7) with a bootstrap standard deviation of $65.0. (Note. The average for the random selection is computed as the Average Random toNP / 298) The average net weekly for the filter would be the filter toNP/ # of OOS periods traded or 40076/229=175. The probability of obtaining our filters average weekly net profit of 175 is 4.15x10⁻⁶ which is 4.45 standard deviations from the bootstrap average. For our filter, in row 3, the expected number of random cases that we could obtain by pure chance that would match or exceed $175 is [1-(1- 4.15x10⁻⁶)]46128 ~= 46128 x 4.15x10-6 = 0.19 where 46128 is the total number of different filters we looked at in this run. This number is much less than one, so it is improbable that our result was due to pure chance given the assumption that the probability distribution of gains and losses has a finite variance.
How To generate an Equity Chart plus a Table with the Equity and Strategy Inputs from the WFME Ave File
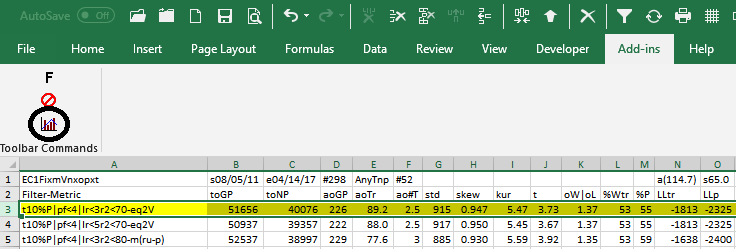
Shown below again is a snippet of the WFME Ave File discussed above. To generate an Equity plot of any given Filter we would select the Filter from Column A as shown in the snippet and then click on the Excel Add-Ins and then click on the black circled Meyers Analytics Macro Icon shown in the snippet. The Excel Equity plot and Table would then immediately appear in Excel as shown below. Note the equity plot shows the equity with costs (brown line, new equity highs are shown as green dots) and without costs(blue line, new equity highs are shown as red dots). The red dotted vertical line separates the 52 Future Results not included in the WFME64 Run. These set of results show how it would turn out if the Strategy Filter chosen from the 298 pwfo files was used on the following 52 pwfo files not included in the WFME64 run. .Any number of Filters could be selected, one at a time by highlighting the column A filter and clicking on the Add-In macro shown , and an Equity chart plus Table would be produced. This Meyers Analytics Excel Equity Chart Add-In macro is supplied with the Walk Forward Metric Explorer v8 and all the other explorers.
Equity Plot Generated By The Meyers Analytics Excel Add-In Macro Shown Above
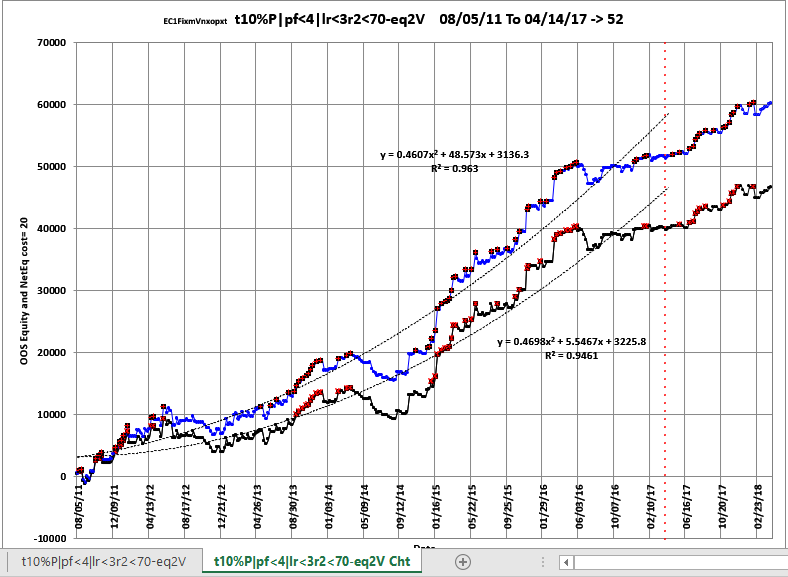
Brown line plot = Net Equity, Equity minus trade costs. New equity highs are shown as green dots.
Blue line plot = Equity without costs. New equity highs are shown as green dots.
The red dotted vertical line separates the 52 Future Results not included in the WFME64 Run. These set of results show how it would turn out if the Strategy Filter chosen from the 298 pwfo files was used on the following 52 pwfo files not included in the WFME64 run.
Excel Table Generated By The Meyers Analytics Excel Add-In Macro Shown Above
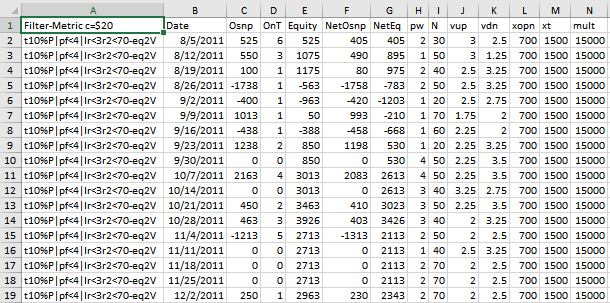
The Excel Table Columns are defined as follows
- Column A The Filter-Metric. Example t10%P|pf<4|lr<3|r2<70-eq2V
- Column B The PWFO File dates
- Column C = The out-of-sample(oos) gross profit for each date using the in-sample strategy inputs.
- Column D = The out-of-sample(oos) number of trades for each date using the in-sample strategy inputs.
- Column E = The out-of-sample(oos) Equity running total.
- Column C = The out-of-sample(oos) net profit (Gross Profit-OnT*Cost) for each date using the in-sample strategy inputs.
- Column G = The out-of-sample(oos) Net Equity (equity minus costs) running total.
- Columns H-N = Strategy Inputs found by the Filter in the in-sample section that gave the out-of-sample results on this same line.
Please see video for a visual explanation.
Click Here For Video: How To Use The Walk Forward PWFO Metric Explorer>
- How to setup, install and run the Walk Forward Performance Metric Explorer. The Walk Forward PWFO Metric Explorer is a stand alone exe file that can be executed directly from your desktop icon or from the Windows Start Program menu.
- How to use the WFME with your PWFO files.
- An explanation of each of the performance statistics columns.
- How to select the best WFME filter to use on real time runs (Past performance is no guarantee of future results).
The WFME Input Finder Excel Add-In
Supplied with the WFME is an Excel Add-In Filter. For the Excel Add-In, as shown below, you just click on a special Add-In icon on the Excel Toolbar and a pop up window displays. Fill in the WFME parameters and click on the Run button. The Excel Add-In macro will filter any number of PWFO files loaded in Excel, and will display the PWFO Excel file row that satisfies the typed in criteria.
The The Walk Forward PWFO Metric Explorer package consisting of Manual, WFME EXE file, and WFME Excel Add-Ins is being offered, for $395. Please note that the WFME will only read files generated by the PWFO product. The WFME has a "Key License" that only allows it to be installed on three computers.