Analytics
applied to algorithmic trading of stocks, futures & forex
Info: (305) 564-6502 support@meyersanalytics.com Telegram @dennis_meyers
Optimizer Walk Forward
Metric Explorer Walk Forward
Input Explorer Walk Forward
Surface Explorer Key Daily & Intraday
Trading Strategies Nth Order Fixed Memory
Polynomial Strategy Nth Order Fading Memory
Polynomial Strategy End Point Fast Fourier
Transform Strategy Goertzel DFT
Strategy Five Parameter
Parabolic Strategy Dennis Meyers
Working Papers
The Power Walk Forward Optimizer v6t
1. How to setup and run the PWFO v6
2. The PWFO v6 output files


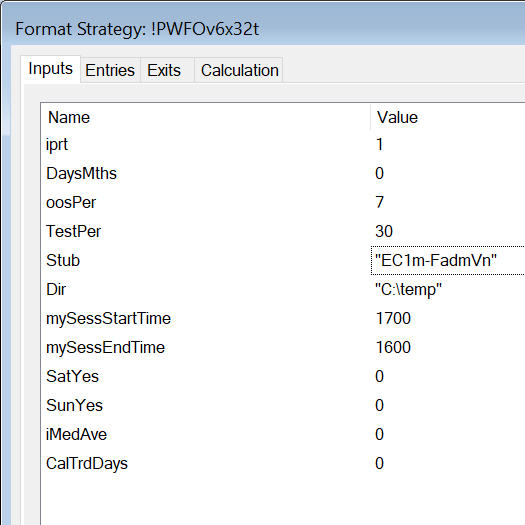
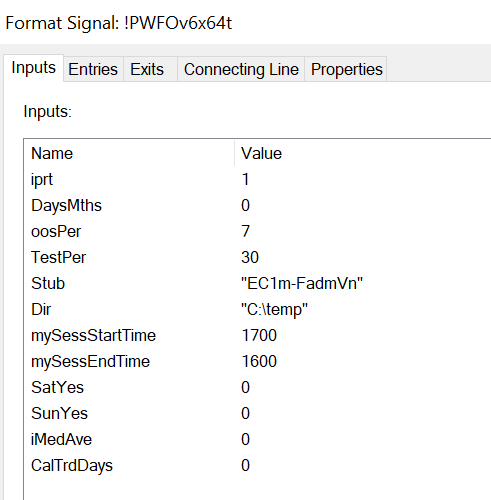
Click here for a description of the PWFOv6 Strategy Form inputs shown above
The Power Walk Forward Optimizer
The Power Walk Forward Optimizer (PWFO) is the best automatic walk forward out-of-sample testing program available. The PWFO eliminates the siren call of curve fitted, data mining performance produced by in-sample optimization of strategy input values on spurious price movements. This package contains a walk forward optimization add-on strategy that can be added to any TradeStation(TS) or MultiChart64(MC) strategy using the TS or MC multiple strategy option. The PWFO prints out 30+ superior and robust in-sample performance metrics and the out-of-sample performance results, on one line, for each strategy input variable combination that is run by the TS/MC optimization engine to a user selected spreadsheet comma delimited file. The PWFO can generate up to 1000 different in-sample and out-of-sample date optimization files in one optimization run saving the user from having to generate optimization runs one at a time. It is not well know but statistically speaking, walk forward out-of-sample (oos) analysis must be performed over many(>50) in-sample/oos sections to be statistically valid. The PWFO output allows you to quickly determine whether your trading rules procedure for selecting input parameters for your strategy just curve fits the price and noise or produces statistically valid out-of-sample results.Out-of-sample testing is the norm in all mathematical economic disciplines other than technical analysis. The basis of walk forward out-of-sample testing is to take a test sample (in-sample) of data, perform a combinatorial input parameter search (dubbed optimization by current trading platforms) on the in-sample data, choose the input parameters from the combinatorial search based upon some performance metric (net profit, profit factor, etc) in the in-sample sample and then apply those input parameters to data they haven't been tested on to see if they work.
Why use walk forward analysis? Why not just optimize over the total amount of data once and choose the inputs from the best performance parameters? Optimization is a misnomer and should really be called Combinatorial search
. That is, we have the software output certain performance metrics like net profit or profit factor for every combination of a range of input parameters. We then sort that range on that performance metric. Whenever you run an combinatorial or genetic search over many different combinations of input parameters on noisy data on a fixed time interval, the best performance parameters found are guaranteed be due to curve fitting
the noise and signal. This curve fitting is also called Data Mining
or Data Snooping
. A fixed number of prices on a fixed time interval has many spurious movements which is also called noise. When we run, say, 5000 different input variations or cases, the best performance parameters will be from those system input variables that are able to produce profits from the price or signal dynamics and the spurious movements . While the signal dynamics, if there, will repeat, the same spurious price movements will not. If the spurious movements that were captured by a certain set of input parameters were a large part of the net profit, then choosing these input parameters would produce losses when traded on future data. These losses occur because the spurious movements will not be repeated in the same way. The input parameters chosen from the in-sample section are cherry picked
to perform well on only those exact same spurious movements. This is why combinatorial or genetic searches with no out-of-sample testing cause loses in the out-of-sample section from something that looked great in the in-sample section.
For each TS/MC run, the user can select the in-sample dates he wants to perform the optimization on and the out-of-sample(OOS) dates for out-of-sample performance. The in-sample and out-of-sample periods are user selectable in calendar days, trading days or exact calendar months. After examining fifty or more different in-sample and out-of-sample files, the user rapidly gets a real feel for the statistics and filters that are important for determining good out-of-sample performance. No more guess work. The PWFO is a real time saver. Please note that the median is used for a number of performance statistics instead of the average. The median is a much more robust measure than the average and is not distorted by outliers. However if the user wishes to use the average instead, there is a PWFO strategy input option for that.
If the optimization run consisted of 5000 different cases of the strategy input variables, then each of the PWFO files would have 5000 lines and each PWFO file would represent only the in-sample and out-of-sample performance for the in-sample/out-of-sample dates selected. Of course if the data loaded into TS/MC was much longer in time, then the PWFO could generate up to 1000 different sample in-sample and out-of-sample date files.
Below are the performance metrics that are printed out for each strategy input variable combination in each PWFO file.
- in-sample Data Performance Metrics
- Input Variables
- The Median of All Trades in the Test(In-Sample) Section (mTrd)
- Total Net Profits of All Trades in Test(In-Sample) Section (tnp)
- Number of Trades (nT)
- Percent Profitable Trades (%P)
- Profit Factor (PF)
- Standard Deviation of Trades(std)
- Student t-statistic. Used to determine the probability that the Ave Trade Profit is > 0 (t)
- The Median of Bars in Losing Trades (mLb)
- Total Losing Bars (tLb)
- The Median of Bars in Winning Trades (mWb)
- Total Winning Bars (tWb)
- Ratio of Median Winning Bars to Median Losing Bars (mWb|mLb)
- Ratio of Total Winning Bars to Total Losing Bars (tWb|tLb)
- Median of all Trades{Maximum Trade Runup minus Final Trade Profit} (m(ru-p))
- Median of all Trades{Final Trade Profit minus Maximum Trade Rundown) (m(p-rd))
- Maximum Consecutive Winners In-A-Row (wr)
- Maximum Consecutive Losers In-A-Row (lr)
- Median Of The Winning Trades (mWTr)
- Median Of The Losing Trades (mLTr)
- Ratio of Median Winning Trades /Median Losing Trades (mWT|LT)
- Maximum Drawdown (dd)
- Largest Losing Trade (llt)
- Slope of Trade Equity Regression Line (eqTrn)
- Trade Equity Regression Trend Line Coefficient of Correlation R2 (eqR2)
- Median of The Deviation between the absolute Values of Each Trade Equity Minus The Equity Regression Trend Line (eqDev)
- Kendall Rank Coefficient -Equity Nonparametric Coefficient Of Correlation (ktau)
- Velocity of Equity Curve Least Squares 2nd Order Polynomial Line.(eq2V)
- Acceleration of Equity Curve Least Squares 2nd Order Polynomial Line. (eq2A)
- Equity Least Squares 2nd Order Polynomial Line Coefficient of Correlation R2 (eq2R2)
- Projected Equity 10 Trades In Future Using Equity Curve Least Squares 2nd Order Polynomial Line.(eq10)
- Modified K-ratio = Slope of Equity Regression Line/ (The Average of The Absolute Values of The Equity at Each Trade Minus The Equity Regression Trend Line). (mKr)
- Out-Of-Sample Data Performance Statistics
- Out-Of-Sample Period total Net Profit (osnp)
- Out-Of-Sample Period Total Number Of Trades (ont)
- Out-Of-Sample Period Winning Trades total Net Profits (ownp)
- Out-Of-Sample Period Winning Number Of Trades (ownt)
- Out-Of-Sample Period Largest Losing Trade (ollt)
- Out-Of-Sample Period Drawdown (odd)
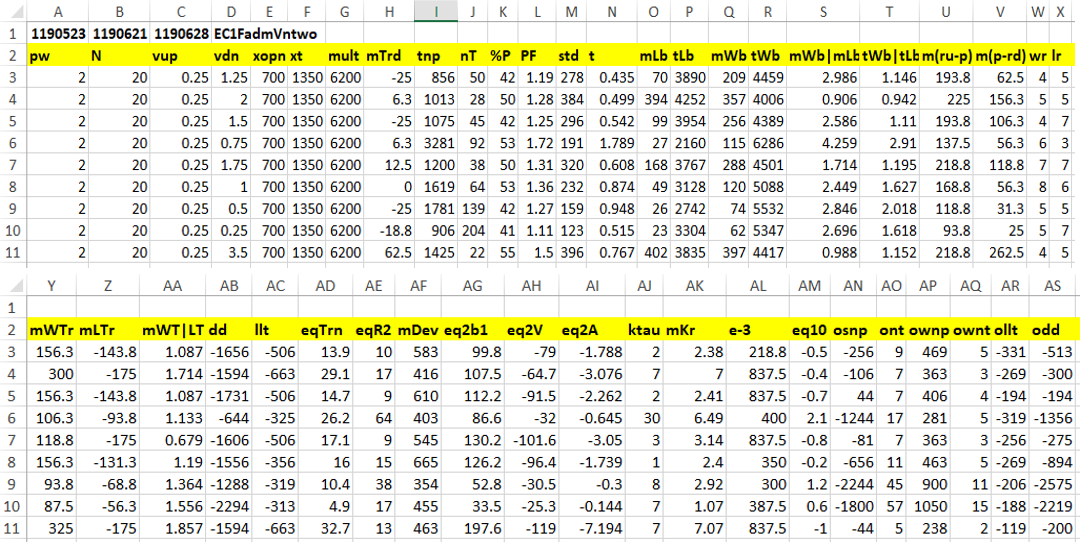
Below is a snippet of the output from a PWFO run. This example shows the partial output for the Fading Memory Polynomial Velocity Strategy for the in-sample dates of 5/23/19 to 6/21/19 and out-of-sample dates of 6/24/16 to 6/28/18. Notice how the out-of-sample results are on the same line as the input parameters and in-sample performance variables. This example is from my working paper Trading 1Min Bar Euro Futures Using the Fading Memory Polynomial Velocity Strategy
This output presentation allows you to see immediately the out-of-sample results from your in-sample performance variable selection techniques. For instance if you wanted to see all those cases that satisfied a Profit Factor greater than 1 and less than 3 with losers in a row of 3 or less, then using Excel's Autofilter feature, you could immediately see all cases that satisfied those criteria and what the out-of-sample results would be.
In addition, using Excel's macro creation ability you can create an excel macro to perform your own performance variable screen with a one button click. This allows you to go through the many walk forward files created by the PWFO in minimal time to see how your performance variable screen or filter works over many in-sample/out-of-sample runs.
The Walk Forward Metric Explorer, The Walk Forward Input Explorer and the Walk Forward Metric Surface Explorer can perform these filter searches and many more automatically and present many out-of-sample performance results for each filter examined.
As noted above, the PWFO uses the median instead of the average for many metrics. The median is a much more robust statistic than the average. As an example look at row 4 on the below spreadsheet snippet. The median trade profit is minus $6.3 while the average trade profit (tnp/nT) is $36. The average can be controlled by a few outliers while the median is robust and immune to these few outliers. However, as also mentioned above, if the user wishes to use the average instead, there is a PWFO strategy input option for that.

How is the use of the PWFO possible with any Strategy? TradeStation's and Multichart's strategy combining window allows for the combining of any number of strategies or signals into one strategy. The PWFO is a strategy that computes and prints out to a user defined directory and Excel file all the performance statistics above using a super fast C++ DLL. For TS or MultiCharts you need to access the Power Editor for your strategy and add the line value99=$6PWFOinp(input1,input2,input3,etc); at the end of "YourStrategy". Then, do a "save as" with a new name like "YourStrategyPWFO", and you are ready to use the PWFO.
The Power Walk Forward Optimizer comes with a detailed manual explaining:
- How to setup a TS or MC with the PWFO and any strategy/signal
- How to use the PWFO with any strategy.
- An explanation of each of the performance statistics.
- How to use the generated optimization Excel output file.
- Walk Forward Optimization tutorial.
User Comparison between TS Walk Forward optimizer(Grail) and the PWFO "The pwfo brought about a deeper understanding of how to properly optimize a system. There are things I learned though that process that I now incorporate into my new strategy development. Even though it was a difficult process, I finished a much wiser system designer. So for me the steep pwfo learning curve was ultimately an advantage. The biggest difference from the grail is that pwfo includes a methodology on how to properly evaluate trading systems. That is not available anywhere else. I spent 6 months using the Grail, prior to encountering the pwfo, optimizing while not being fully aware that I didn't know how to properly interpret my results and guide my decisions in a more consistently and profitable way. This resulted in all my systems not conforming to my back test results in real time. The next difference in systems is a huge improvement as well. Using metric filters to arrive at my final trading input variables is not discussed or possible with the grail and I think the pwfo method is superior. Further more the best way to optimize in pwfo is to give up profit and explore metrics/variables that reside in the median values. That is not discussed or possible with the grail. A typical grail optimization will take me a few hours. A typical pwfo optimization requires at least 4 full optimization runs and a lot of thinking and comparing so this process requires a minimum of 1 day and often many days. There are fewer statistics in a grail optimization run and it is not currently possible to export All the results from grail to an excel spreadsheet for further analysis. There is an export function in Grail but it will not export all the variables or the walk forward tests, only 1 final optimized test result. So I am forced in Grail to view the results inside TradeStation."
Compatibility Note: It is possible to use the PWFO with any TS or MC strategy. However, if the strategy is locked, read protected or cannot be accessed and changed by the Power Editor, then the PWFO will not work with that strategy. Otherwise if the strategy is accessible and can be edited by the Power Editor then that strategy will work with the PWFO.
For TradeStation or MultiCharts64, the Power Walk Forward Optimizer v6t package consisting of manual, DLL files and TradeStation ELD file or MC64 PLA file and is being offered, for $395. The PWFO has a "Key Licence" that allows it to be installed on three computers.
How To OrderTo order online click Order Online. If you would like to talk to me about the product, please call me at (305) 564-6502 M-F 12pm to 5pm CST. All E-mail queries can be sent to support@meyersanalytics.com.
Thank you for your Interest....Dennis Meyers