Analytics
applied to algorithmic trading of stocks, futures & forex
Info: (305) 564-6502 support@meyersanalytics.com Telegram @dennis_meyers
Optimizer Walk Forward
Metric Explorer Walk Forward
Input Explorer Walk Forward
Surface Explorer Key Daily & Intraday
Trading Strategies Nth Order Fixed Memory
Polynomial Strategy Nth Order Fading Memory
Polynomial Strategy End Point Fast Fourier
Transform Strategy Goertzel DFT
Strategy Five Parameter
Parabolic Strategy Dennis Meyers
Working Papers
The Walk Forward Strategy Inputs With Metric Filtering Explorer v8x
1. How to Use The Walk Forward Input Explorer
2. How To Find a Good Metric Filter In The WFINP Ave File Output
3. How To Determine Whether To Trade The Strategy Inputs found by the WFINP Next OOS Period


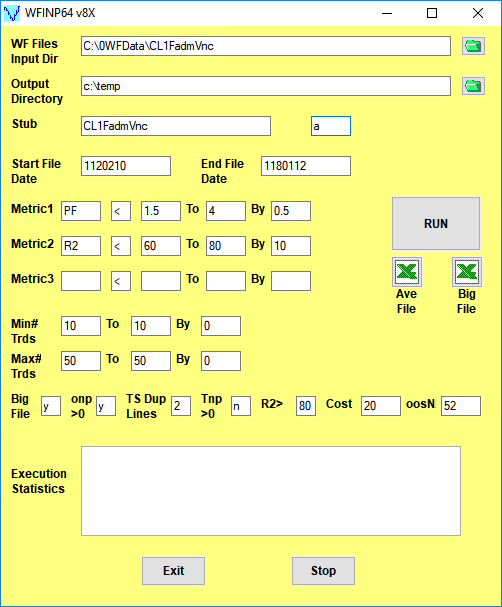
Click here for a description of the WFINP64 v8X Form inputs
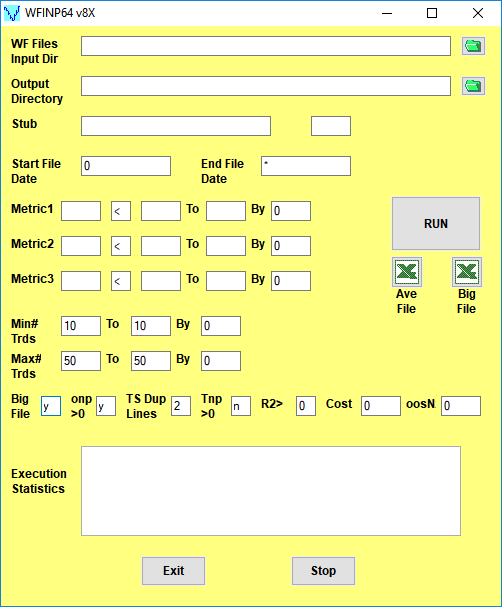
Note: On first use, the form inputs are blank as above. The WFINP64 v8X saves whatever user inputs are entered onto the form and thereafter loads those inputs onto the form with next use
The Walk Forward Strategy Input With Metric Filters Explorer v8X
The Walk Forward Strategy Inputs with Metric Filtering (WFINP64) v8x is a standalone 64bit exe program that is super-fast and automatically displays its extensive statistical results in Excel. The WFINP reads all files generated by the PWFO and searches each PWFO file for the best combination of Strategy Inputs and performance metrics Filters that generate the statistically best average out-of-sample performance. A Strategy Input/filter summary is generated and sorted by total out-of-sample net profits after costs for all Strategy Input/ metric combination filters examined and written to a comma delimited Excel file by the WFINP. In addition, using modern "Bootstrap" techniques, the WFINP calculates the probability of whether each Strategy Input/filter out-of-sample results were due to chance. When the WFINP run is done just click on the Excel Icon next to the Run button and the WFINP output file will appear in Excel or your spreadsheet.
To see an example and description of the WFINP64 run output file click here
Minimizing Curve Fitted Performance Results. What do we mean by "curve fitting"? The price series that we trade consists of random spurious price movements, which we call noise, and repeatable price patterns (if they exist). When we run, for example, 5000 different strategy input parameter combinations, the best performance metrics will be from those strategy input combinations that are able to produce profits from the price pattern and the random spurious price movements. While the price patterns will repeat, the same spurious price movements will not. If the spurious price movements that were captured by a certain set of strategy input parameters were a large part of the total net profits, which they are in most price series, then choosing these "best profits" input parameters will produce losses when traded on future data from what looked like the holy grail in the optimization output run.
If we eliminate the in-sample optimization cases with the very best performance metric results we can eliminate many of the data mining strategy input parameters that fitted the past spurious and random price movements. As an example, let us choose Metric1 as the Profit Factor(PF). The PF is an good performance metric for eliminating the curve fitted strategy input parameters because the best performance usually has the best Profit Factors. If we eliminate all cases that have PFs above a certain level we can eliminate many of the curve fitted in-sample strategy input parameter cases. As another example let us choose Metric2 as R2., R2 is the equity curve straight line correlation coefficient for each set of strategy inputs of the in-sample equity curve. The higher the in-sample R2 the higher the chance that the strategy inputs are fitting the price pattern AND the random spurious price movements. If we eliminate all cases that have R2s above a certain level we can eliminate many of the curve fitted in-sample strategy input parameter cases. The WFINP eliminates, in this example, the curve fitted results by filtering out of the PWFO file's in-sample sections those input parameters that have PFs greater than some user chosen value and/or R2s of greater than a user chosen value . This type of input filter means that one would not be trading a given set of inputs every out-of-sample week until the in-sample section before it has a PF and/or R2 below our criteria. We used PF and R2 as metric filter examples here but the user can choose any combination of performance metrics he chooses for filters. The in-sample Metrics criteria ranges are user selectable generating many filter searches in one run. The WFINP determines which strategy inputs with metric filters generate the statistically best average out-of-sample returns. In addition the WFINP64 v8x version allows you to withhold a number of pwfo files from the WFINP64 oos run so you can see how any Strategy Input/Filter would perform if used in the future. The Metric1, Metric2 and Metric3 are user selectable so you can choose which Metric1,2,3 values suit you. The strategy input with metric filters summary is sorted by total out-of-sample net profits after costs for all the various strategy input/filters and written to a comma delimited file by the WFINP. When The WFINP run is done just click on the Ave File Excel Icon and the WFINP output file will appear in Excel as shown below.
The WFINP64 v8X Ave File Definition
After the WFINP has completed it's run click in the Excel icon above Ave File on the WFINP form and the Ave File automatically loads into Excel. Below is a snippet of the Ave File output from a WFINP run sorted by the total out-of-sample net profit statistic (toNP). This example shows the partial output file from a WFINP64 v8X run on the PWFOv5t files generated with the Nth Order Fading Memory Polynomial Strategy that was run on 1 contract of the Crude Light(CL) 1 minute bar futures for the 310 weeks from 2/10/2012 to 1/12/2018. The in-sample(IS) period is 30 calendar days and the out-of-sample(OOS) period is 7 calendar days or one week. Sundays were automatically skipped because this strategy only traded between 9am to 1429pm Exchange Time(EST)


The WFINP AVE File Output Cols are defined as follows
- Row 1, Columns:
- A=The PWFO Stub, B=File Start Date, C=File End Date, D= Number of oos periods(in this example weeks), N= Bootstrap average, O= Bootstrap Standard Deviation, P=Number of filters run, U= Cost/trade
- Row 1 and Row 2 Columns AB,AC,AD,AE,AF Future Results Not Included in the WFINP64 Run. These set of results show how it would turn out if the Strategy Inputs/Filter was used on pwfo files not included in the WFINP64 run.
- Row 1 Col AB: Future PWFO File Start Date
- Row 1 Col AC: Future PWFO File End Date
- Row 1 Col AD: Future Number of PWFO Files not included in the WFINP64 run (in this example weeks)
- Row 1 Col AH: Number of Total oos+future PWFO Files
- Row 2 Col AB: toGPx Total gross profit for the 22 future excluded periods(for this run periods = weeks).
- Row 2 Col AC: toNPx Total Net profit(toGP-Number Of Trade Weeks*cost) for the 22 future excluded periods.
- Row 2 Col AD: aoTrx Average profit per trade for the 22 future excluded periods
- Row 2 Col AE: aoNTx Average number of trades per week for the 22 future excluded periods
- Row 2 Col AF: #x The number of the 22 future excluded periods this strategy/filter traded. Note for some periods there can be no strategy inputs/filter that satisfy the Strategy Inputs Filter criteria and no trades will be made during that period.
- Row 2 to Last Row Columns: A through AH
- Col A: The Strategy Input/Filter Names
- Example Row 3: 2|70|0.5|3|900|1429|36|pf<2.5|r2<60: The inputs 2|70|0.5|3|900|1429|36| for all in-sample files that have PF≤2.5 and/or R2 ≤60.
- Col B: toGP
- Total out-of-sample(oos) gross profit for these 288 oos periods(for this run periods = weeks).
- Col C: toNP
- Total out-of-sample(oos) Net profit(toGP-Number Of Trade Weeks*cost) for the 288 oos periods.
- Col D: aoGP
- Average oss gross profit for the 288 oos periods
- Col E: aoTr
- Average oos profit per trade
- Col F: ao#T
- Average number of oos trades per week
- Col G: std
- The standard deviation of the 288 oos period profits and losses
- Col H: skew
- The Skew statistic of the 288 oos period profits and losses
- Col I: kur
- The kurtosis statistic of the 288 oos period profits and losses
- Col J: t
- The student t statistic for the 288 oos periods. The higher the t statistic the higher the probability that this result was not due to pure chance
- Col K: oW|oL
- Ratio of average oos winning trades divided by average oos losing trades .
- Col L: %Wtr
- The percentage if oos winning trades
- Col M: %P
- percent of all oos periods that were profitable.
- Col N: LLtr
- The largest losing oos trade in all oos periods
- Col O: LLp
- The largest losing oos period
- Col P: eqDD
- The oos equity drawdown
- Col Q: wpr
- The largest number of winning oos periods (weeks) in a row.
- Col R: lpr
- The largest number of losing oos periods in a row
- Col S: #
- The number of oos periods this filter produced any profit or loss. Note for some oos periods there can be no strategy inputs that satisfy a given filters criteria and no trades will be made during that period.
- Col T: eqTrn
- The straight line trend of the oos equity curve in $/oos period.
- Col U: eqV^2
- The velocity of a 2nd order polynomial that is fit to the equity curve.
- Col V: Dev^2
- A measure of equity curve smoothness. The square root of the average (equity curve minus a straight line)^2)
- Col W: KTau^2
- The Kendall rank coefficient is often used as a test statistic in a statistical hypothesis test to establish whether two variables may be regarded as statistically dependent. This test is non-parametric, as it does not rely on any assumptions on the distributions of X or Y or the distribution of (X,Y)
- Col X: eqR2
- The correlation coefficient(R^2) of a straight line fit to the equity curve.
- Col Y: Blw
- The maximum number of oos periods the oos equity curve failed to make a new high.
- Col Z: BE
- Break even in oos periods. Assuming the average and standard deviation are from a normal distribution, this is the number of oos periods you would have to trade to have a 98% probability that your oos equity is above zero.
- Col AB: toGPx
- Total gross profit for the 22 future excluded periods(for this run periods = weeks).
- Col AC: toNPx
- Total Net profit(toGP-Number Of Trade Weeks*cost) for the 22 future excluded periods.
- Col AD: aoTrx
- Average profit per trade for the 22 future excluded periods
- Col AE: aoNTx
- Average number of trades per week for the 22 future excluded periods
- Col AF: #x
- The number of the 22 future excluded periods this strategy/filter traded. Note for some periods there can be no strategy inputs/filter that satisfy the Strategy Inputs/Filter criteria and no trades will be made during that period.
- Col AG: tOnpNet
- toNP+toNPx = Total Net Profits of oos+future periods
- Col AH: Prob
- The probability that the filters oos toNP was due to pure chance. Row 1 lists the random bootstrap average for the 288 out-of-sample files of ($134.9) with a bootstrap standard deviation of $82.8. (Note. The average for the random selection is computed as the Average Random toNP/288) The average net weekly for the filter would be the filter toNP/ (# of OOS) periods traded or 76400/219=348.8. The probability of obtaining our filters average weekly net profit of 348.8 is 2.61x10⁻⁹ which is 5.84 standard deviations from the bootstrap average. For our filter, in row 3 , the expected number of cases that we could obtain by pure chance that would match or exceed $348.8 is [1-(1- 2.61x10⁻⁹)^96767 ~= 96767 x 2.61x10-9 = 0.00025 where 96767 is the total number of different filters we looked at in this run. This number is much less than one so it is improbable that our result was due to pure chance
How To generate an Equity Chart plus a Table with the Equity and Strategy Inputs from the AVE File
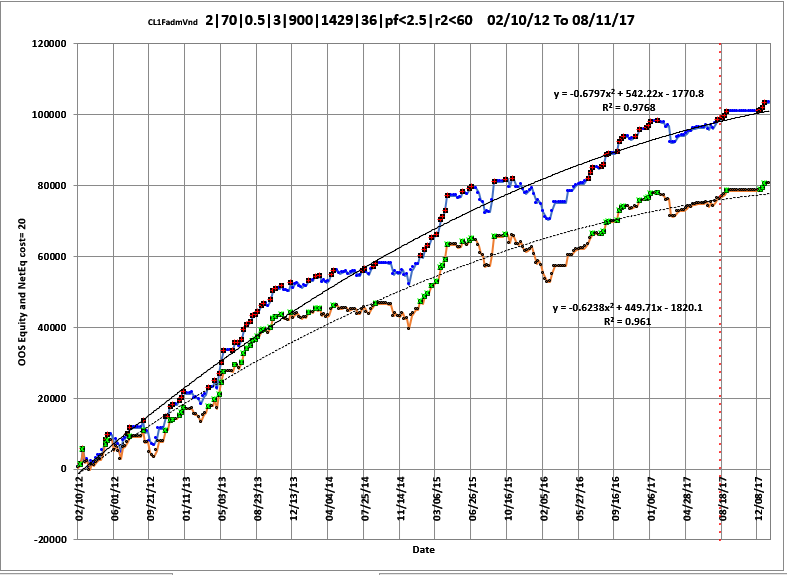
Shown below again is a snippet of the AVE File discussed above. To generate an Equity plot of any given Filter we would select the Filter from Column A as shown in the snippet and then click on the Excel Add-Ins and then click on the black circled Meyers Analytics Macro Icon shown in the snippet. The Excel Equity plot and Table would then immediately appear in Excel as shown below. Note the equity plot shows the equity with costs (brown line, new equity highs are shown as green dots) and without costs(blue line, new equity highs are shown as red dots).Any number of Filters could be selected, one at a time by highlighting the column A filter and clicking on the Add-In macro shown , and an Equity chart plus Table would be produced. This Meyers Analytics Excel Equity Chart Add-In macro is supplied with the Walk Forward Strategy Inputs With Metric Filtering Explorer v8x.

Equity Plot Generated By The Meyers Analytics Excel Add-In Macro Shown Above

Red line plot = Net Equity, Equity minus trade costs. New equity highs are shown as green dots.
Blue line plot = Equity without costs. New equity highs are shown as green dots.
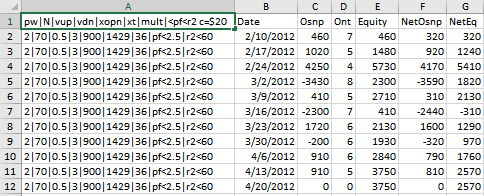
Excel Table Generated By The Meyers Analytics Excel Add-In Macro Shown Above

The Excel Table Columns are defined as follows
- Row 1 is the Date, Filter-Metric, Osnp, Ont and Strategy Inputs found in the in-sample section by the Filter..
- Column AThe Strategy Input/PF|R2 Filter. Example 2|70|0.5|3|900|1429|36|pf<2.5|R2<60
- Column B The PWFO File dates
- Column C = The out-of-sample(oos) net profit for each date for these in-sample strategy inputs.
- Column D = The out-of-sample(oos) number of trades for each date for these in-sample strategy inputs.
- Column E = The out-of-sample(oos) The oos Equity running total.
- Column F = The out-of-sample(oos) The net oos = oos minus trades*cost
- Columns G = The out-of-sample(oos) Net Equity (equity minus costs) running total
The Walk Forward Strategy Input with Filter Explorer comes with a detailed manual explaining:
- How to setup and install the Walk Forward Strategy Input with Filter Explorer. The Walk Forward Input Explorer is a stand alone exe program that can be executed directly from your desktop icon or from the Windows Start Program menu.
- How to use the WFINP64 v8x with your PWFO files.
- An explanation of each of the performance statistics columns.
The The Walk Forward Strategy Inputs with Filter Explorer package consisting of Manual, WFINP64 v8x EXE file, and WFINP64 Excel Add-Ins is being offered, for $395. Please note that the WFINP64 will only read files generated by the PWFO product. The WFINP64 v8x has a "Key License" that only allows it to be installed on three computers.
How To Order
To order online click Order Online. If you would like to talk to me about the product, please call me at (305) 564-6502 M-F 12pm to 5pm CST. All E-mail queries can be sent to support@meyersanalytics.com.
Thank you for your Interest....Dennis Meyers