Meyers
Analytics
Analytics
Advanced Mathematical Trading Strategies & Walk Forward Out-Of-Sample Analysis
applied to algorithmic trading of stocks, futures & forex
Info: (305) 549-5843 support@meyersanalytics.com
applied to algorithmic trading of stocks, futures & forex
Info: (305) 549-5843 support@meyersanalytics.com
Order Online
Power Walk Forward
Optimizer Walk Forward
Metric Explorer Walk Forward
Input Explorer Walk Forward
Surface Explorer Key Daily & Intraday
Trading Strategies Nth Order Fixed Memory
Polynomial Strategy Nth Order Fading Memory
Polynomial Strategy End Point Fast Fourier
Transform Strategy Goertzel DFT
Strategy Five Parameter
Parabolic Strategy Dennis Meyers
Working Papers
Walk Forward Metric Explorer x64 v8x Form Description


Walk Forward Performance Metric Explorer (WFME) Input Definitions
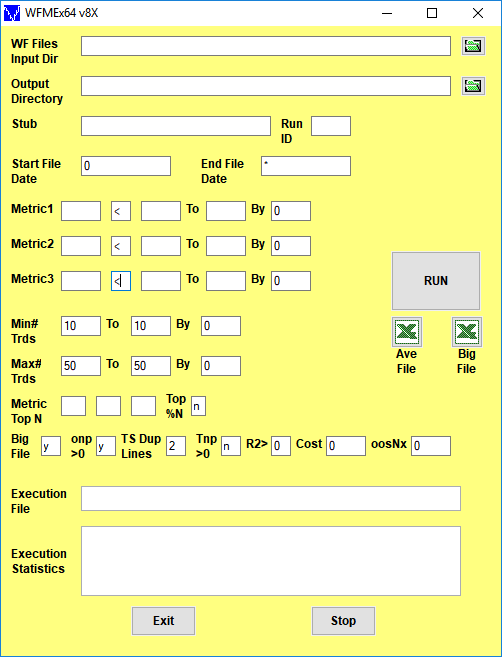
- WFME Form
- On first use, the WFME form inputs are blank as above. The WFME saves whatever user inputs are entered onto the form and thereafter loads those inputs onto the form with next use.
- WF Files Input Dir
- Directory where the PWFO Files are Located
- Output Dir
- Directory where the WFME output files are to be written
- Green folder Icons
- A click on these icons allow you to browse for the directory you wish to use
- Stub
- The Stub in the PWFO file name that the PWFO input created
- Run ID
- A unique ID for this WFME run set by the user.
- Start File Date
- The date, in TS Format, that the run is to start with. A 0 means the first PWFO file in the input directory
- End File Date
- The date, in TS Format, that the run is to end with. A * means the last PWFO file in the input directory
- Metric1 Text Box and [ < or > ] Text Box
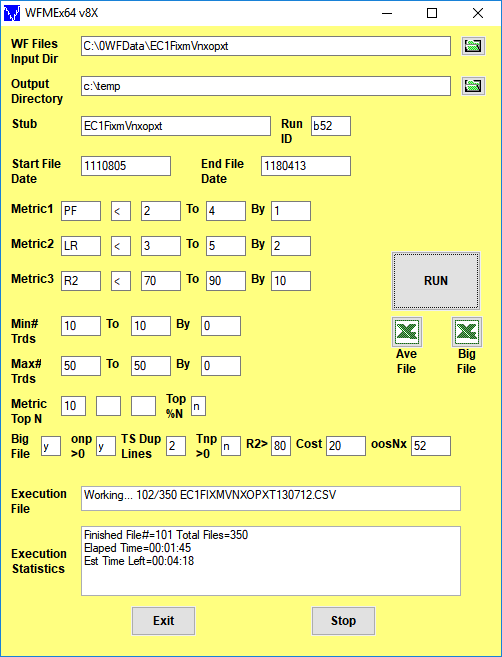
- Enter Metric1 symbol into Text Box (your choice but showing PF as an example), the filter range you want to examine. For the text box case [<] as shown above, the WFME examines filters that satisfy each of these criteria: Metric1(PF) ≤ 2,3,4, ALL. If the [ < or > ] Text Box was set to [>] , then the WFME would examine filters that satisfy each of these criteria: Metric1(PF) ≥ 2,3,4, ALL. All means there is a run added where all Metric1's are considered, no matter what their value, for comparison in the final printout. The Metric1(PF) range and step box inputs can be changed by the user. If you did not wish to use the Metric1 filter then you would set the By box to zero(0).
- Metric2 Text Box and [ < or > ] Text Box
- Enter Metric2 symbol into Text Box (your choice but showing LR as an example), the filter range you want to examine. For the text box case [<] as shown above, the WFME examines filters that satisfy each of these criteria: Metric2(LR) ≤ 3,5, ALL. If the [ < or > ] Text Box was set to [>] , then the WFME would examine filters that satisfy each of these criteria: Metric2(LR) ≥ 2,5, ALL. All means there is a run added where all Metric2's are considered, no matter what their value, for comparison in the final printout. The Metric2(LR) range and step box inputs can be changed by the user. If you did not wish to use the Metric2 filter then you would set the By box to zero(0).
- Metric3 Text Box and [ < or > ] Text Box
- Enter Metric3 symbol into Text Box (your choice but showing R2 as example), the filter range you want to examine. For the text box case [<] as shown above, the WFME examines filters that satisfy each of these criteria: Metric3(R2) ≤ 70,80,90, ALL. If the [ < or > ] Text Box was set to [>] , then the WFME would examine filters that satisfy each of these criteria: Metric3(R2) ≥ 70,80,90, ALL. All means there is a run added where all Metric1's are considered, no matter what their value, for comparison in the final printout. The Metric3(R2) range and step box inputs can be changed by the user. If you did not wish to use the Metric3 filter then you would set the By box to zero(0).
- Min# Trds=
- The minimum number of trades (NT) in the in-sample section for each filter. In the example above the WFME filters for in-sample section number of trades ≥10. If you only wanted to filter for one NT, say NT≥10 then you would set the NT boxes to 10, 10, 1 respectively. The NT range and step box inputs can be changed by the user. If you did not wish to use the NT filter then you would set the By box to zero(0).
- Max# Trds=
- The maximum number of trades (NT) in the in-sample section filter. In the example above the WFME does not filter for Max# of trades. If you only wanted to filter for one NT, say NT≤50 then you would set the NT boxes to 50,50, 1 respectively. The NT range and step box inputs can be changed by the user. If you did not wish to use the NT filter then you would set the By box to zero(0) as shown above.
- Metric Top N Boxes (3 of them)
- This portion of the filter selects the rows in the PWFO file that have the TOP N (highest N) Metrics after the Metric1, Metric2, Metric3 and NT filters described above are applied. N can be any number like, 5, 10, 20 or any user input number. We use the term TOP N because in the Excel AutoFilter if you select TOP 10 on any column it will display all rows that have the highest 10 values in that column. As an example suppose we wanted to examine only the PWFO rows in the in-sample section that had the Top 10 eqTrn's (Slope Of Trade Section Equity Trend Line) after the Metric2, Metric3 and NT filters are applied. WFME would show us only the rows that had the highest 10 values in the eqTrn column from the rows that are left after the Metric2, Metric3 and NT filter had been applied Note: the WFME can examine up to 3 TOP N's in one run (like the top5, top10 and top20). If the last Top N box is left blank then the WFME run will examine only 2 TOP N's. If the last 2 boxes are left blank then the WFME will only examine 1 TOP N. If all Top N boxes are left blank then the WFME run will only run cases that satisfy the Metric1, Metric2 and Metric3 filters. To cut down on the number of filters and reduce the probability that the best filter's results can be produced by chance, I usually use only 1 or 2 TOP N boxes like 10 and 20 or 10 and 50 or just 10. The PWFO Metrics, nT, std, mLb, tLb, m(RU-p),and mDev(see the PWFO manual for these metric definitions) need a Bottom N search because we are looking for the minimum of these values. The WFME automatically searches for the Bottom N of these metrics instead of the TOP N.
- Top %N
- If y then the Top %N(N=0.5% or 1%, etc) Rows of the PWFO file are examined instead of the Top N Rows.
- Big File
- If y, a very large csv file is generated that lists each periods oos profits and number of trades for each filter. This file is used by our Excel Add-In to generate the equity plot, and data for any filter in the Ave File. If you only wished to look at the AVE File you would put n and save space and run time
- onp >0
- If y, then only filters that generate positive total net profits are written to the AVE and BIG csv files.
- TS Dup Lines
- For TS set to 2. For MultiCharts set to 0. Note after an optimization TS generates an additonal output line or two in the end of the PWFO files which are the inputs of the best total net profits found. These inputs are already in each pwfo files in the order they were run.
- Tnp>0
- If this box is set to y then all cases that satisfy the filters above but do not have the test total net profits (tnp) in the in-sample section greater than zero are eliminate. If this box is set to n then all cases that satisfy the filters above including the cases where tnp is negative in the in-sample section, are included.
- R2 >
- R2 is the equity curve straight line correlation coefficient. If set to a number then only those filters that have an R2 > that number will be printed out to the AVE file.
- Cost
- This is the round trip slippage and commissions you wish to subtract from each trade.
- oosNx
- Number of future periods to NOT include in the WFME64 v8x run. This shows what would happen to performance using the Inputs/Filter on future pwfo files that were not included in the WFME64 v8x run
- Ave File Excel Icon
- When this Icon is clicked the WFME Walk Forward Results output is immediately displayed in your Excel spreadsheet
- Big File Excel Icon
- When this Icon is clicked the WFME Big File output is immediately displayed in your Excel spreadsheet. This is a very large file and is only used by the Excel Add-In to generate the equity plot and data for any chosen filter in the WFME Results output Excel file. Usually the file is too big to load into excel and too see you must use a text app that can load millions of lines
- Execution Statistics
- The run time execution status. During run time this displays the PWFO file number and file name that the WFME program is currently running and after the run time execution status.