Meyers
Analytics
Analytics
Advanced Mathematical Trading Strategies & Walk Forward Out-Of-Sample Analysis
applied to algorithmic trading of stocks, futures & forex
Info: (305) 549-5843 support@meyersanalytics.com
applied to algorithmic trading of stocks, futures & forex
Info: (305) 549-5843 support@meyersanalytics.com
Order Online
Power Walk Forward
Optimizer Walk Forward
Metric Explorer Walk Forward
Input Explorer Walk Forward
Surface Explorer Key Daily & Intraday
Trading Strategies Nth Order Fixed Memory
Polynomial Strategy Nth Order Fading Memory
Polynomial Strategy End Point Fast Fourier
Transform Strategy Goertzel DFT
Strategy Five Parameter
Parabolic Strategy Dennis Meyers
Working Papers
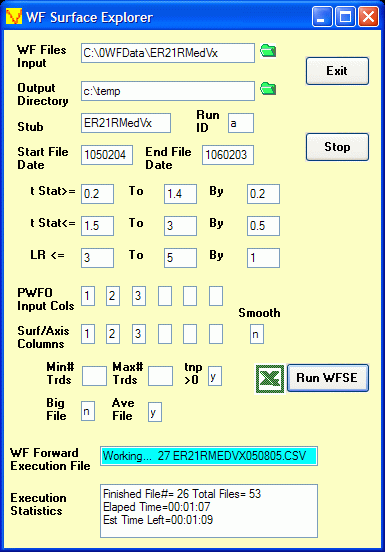
Walk Forward Surface Explorer (WFSE) Input Definitions

- WF Files Input
- Directory where the PWFO Files are Located
- Output Directory
- Directory where the WFSE output file is to be written
- Green folder Icons
- A click on these icons allow you to browse for the directory you wish to use
- Stub
- The Stub in the file name that PWFO created
- Run ID
- A unique ID for this WFSE run
- Start File Date
- The date, in TS Format, that the run is to start with. 0 = the first PWFO file in the input directory
- End File Date
- The date, in TS Format, that the run is to end with. * = last PWFO file in the input directory
- t Stat >=
- t stat is the student t statistic for the total net profit(tnp) for each case. This statistic measures the probability that the tnp for this case is not due to chance and is greater than zero. For the minimum gradient of a surface we wish to find the highest flattest plateau. There are many flat plateaus. We wish to find the flat plateau with the highest tnp. The t stat is highly correlated with tnp and acts like a "normalized" tnp so we can use it across all cases and all PWFO files to produce normalized results. In this case we want to examine minimum gradients that have a minimum t stat of: t Stat >= 0.4,0.5,0.6....1.8, ALL. Note there is a run added where all t stats are considered for comparison in the final printout.
- t Stat <=
- The t stat is highly correlated with tnp and acts like a "normalized" tnp so we can use it across all cases and all PWFO files to produce normalized results. We know that systems that curve fit the signal and noise have high tnp's and thus t's. Very few trading systems can sustain t stats above 3 or 4 over time. Therefore if we eliminate from the test sample optimization results, all cases that have t stats greater than 3, we will likely eliminate most of the cases in each test section that are due to curve fitting the noise. In this case we want to examine minimum gradients that have a maximum t stat of: t Stat <= 1.5,2,2.5,3, ALL. Note there is a run added where all t stats are considered for this filter for comparison in the final printout.
- LR <=
- The LR filter range you want to examine. In this case you want to examine minimum gradients that satisfy each of these criteria: LR<= 3, 4, 5, all. Note there is a run added where all LR's are considered for comparison in the final printout.
- PWFO Input Cols
- These are the input variable column numbers in the PWFO files whose strategy inputs change. Up to six input columns can be entered
- Surf/Axis Cols
- These are the input variable column numbers in the PWFO files that the WFSE will use as it's surface axis to find the gradient for the performance variable. Up to six input columns can be entered
- Min # Trds
- The minimum number of trades in the test sample for each WFSE. In this case you want to examine minimum gradients that satisfy Min # Trds criteria .
- Max # Trds
- The maximum number of trades min the test sample for each WFSE. In this case you want to examine minimum gradients that satisfy Min # Trds criteria
- Tnp>0
- If this box is set to y then all cases that satisfy the filters above but do not have the test total net profits (tnp) in the test section greater than zero are eliminate. If this box is set to n then all cases that satisfy the filters above including the cases where tnp is negative in the test section, are included.
- Big File
- If yes a very large file is generated that lists each weeks out-of-sample profits for each filter
- Ave File
- This is the output file shown in the WFSE write up
- Excel Icon
- When this Icon is clicked the WFSE output is immediately displayed in your Spreadsheet
- WF Execution File
- During run time this displays the PWFO file number and file name that the WFSE program is running
- Execution Statistics
- The run time execution status. In this example 26 out of 53 files have been processed. The elapsed time is 1min 7sec and the estimated time left to finish is 1min 9sec